Corporate GIS

The corporate GIS is envisaged to have datasets that are shared by all the users in an organization. With rerefence to the global Spatial Data Infrastructure (SDI), the spatial datasets in association with policies, organisational remits, technologies, standards, delivery mechanisms, and financial and human resources inherent in the integrated corporate GIS of an organisation constitute a SDI, a corporate SDI. As other levels of SDIs
will all draw on the spatial datasets from the corporate SDIs, the corporate SDIs form the base level in the hierarchy of SDIs.

We can disaggregate a corporate GIS into two basic modules:
Business Process GIS and Infrastructure GIS.

The corporate GIS is an integral part of the production process of an organisation. In such a corporate GIS, certain collections of GIS capabilities (GIS modules) have the function of directly generating the products and/or services required of the organisation. These modules are called business process GIS.

The remaining GIS modules support the development and functioning of the business process GIS and are called infrastructure GIS..

Both groups of GIS modules include the five generic elements of GIS, i.e. data, standards, people, information technology and organisational setting.

Conclusively GIS integration is significantly weaker when one infrastructure GIS provides other GIS modules with products or services that do not conform to a common set of standards.

To know more on it mail to agilyticsmail@gmail.com                                                                    #agilytics, your GIS builder.

Leave a comment

Autocorrelation using Python

autocorr

A times series is a series of data points which are listed (indexed) in time order. Simply a time series is a sequence taken at successive equal interval points in time. Therefore, it is a sequence of discrete-time data.
The correlation for time series observations with observations with previous time steps (lags) can be calculated. As the correlation of the time series observations is calculated with values of the same series at previous times, this is called a serial correlation, or an AUTOCORRELATION.
The pandas is an open source, BSD-licensed library providing high-performance, easy-to-use data structures and data analysis tools for the Python programming language.
Following modules are to be imported to carry out time series analysis:

import pandas
import numpy
from pandas import Series, DataFrame, Panel

pandas.Series.autocorr()
can be used to calculate autocorrelation on Series with lag-N (default=1).

However, to calculate autocorrelation on a dataframe, following function can be utilized: –

def df_autocorr(df, lag=1, axis=0):
       “””Compute full-sample column-wise autocorrelation for a DataFrame.”””
       return df.apply(lambda col: col.autocorr(lag), axis=axis)
d1 = DataFrame(np.random.randn(100, 6))df_autocorr(d1)

Questions? Please feel free to write to agilyticsmail@gmail.com


Posted in Predictive Data Analytics | Leave a comment

Assumptions of the classical regression model

As a series of articles on Predictive Data Analytics, the team Agilytics will be publishing some of the fundamental concepts. The classical normal linear regression model can be used to handle the twin problems of statistical inference i.e.

  1. Estimation
  2. Hypothesis Testing

Capture

The classical regression model is based on several simplifying assumptions. These 10 assumptions are as follows: –

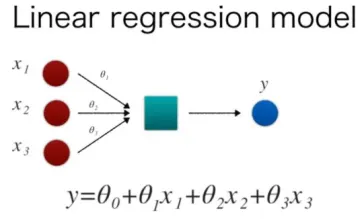
Assumption 1: The regression model is linear in the parameters.

Assumption 2: The values of the regressors, the X’s, are fixed, or X values are independent of the error term. Here, this means that there is zero co-variance between u and each X variable.

Assumption 3: For given X’s, the mean value of disturbance Ui is zero.

Assumptions 4: For given X’s, the variance of Ui is constant or homoscedastic.

Assumptions 5: For given X’s, there is no auto-correlation, or serial correlation, between the disturbances.

Assumptions 6: The number of observations n must be greater than the number of parameters to be estimated.

Assumptions 7: There must be sufficient variation in the values of the X variables.

Assumptions 8: There is no exact collinearity between X variables.

Assumptions 9: The model is correctly specified, so there is no specification bias.

Assumptions 10: The stochastic (disturbance) term Ui is normally distributed.

The Ordinary Least square (OLS) estimators are BLUE (Best Linear Unbiased Estimators) and require above 10 assumptions to be fulfilled.

Next I will be explaining Autocorrelation, Heteroskedasticity and Multicollinearity in separate articles in this series.

Please feel free to email to agilyticsmail@gmail.com for queries.

Posted in Predictive Data Analytics | Tagged , , , | Leave a comment

Product Thinking and Thought Leadership

“There is an industry-wide shift toward more ‘product thinking’ in leadership                        –leaders who understand the social and cultural contexts in which our technologies are deployed”- Damon_Horowitz

The thought leaders are not the ones who climbed up the career ladder in a dully, step by step manner. The leaders are the ones who can take calculated risks and develop unique perspectives and designs for the products. In practice we have to see the product first. A feature may (or may not) be a useful part of a product but without the product the feature is a waste of space.

What’s the Problem?

The first step of product thinking is to determine the problem that the customers are looking to solve. Apparently that is the main reason why they will buy the product as long as it actually solves the problem in a valuable way.

What Do You Solve For?

Explore the problems which can be solved by the company most effectively and show-case the solution sets. The rapidly changing landscape of the market has resulted in the difficulty to identify what the companies are great at solving for. This is both internally with their employees and externally with clients and supply chain partners.

Cease to be the order takers and allow thought leadership to provide value components to the business model that strengthens company’s marketplace reputation and makes the client relationships more profitable.

Who Are the Game Changers?

By applying new ways of thinking to propel growth, innovation and opportunity are the game changers. The game changers are the ones that intimately understand the mechanics involved with each vertical of business, trends, competitive pressures and where the growth opportunities exist. Game changers champion ideas and fuel new thinking. They are not afraid to change the conversation as corporate entrepreneurs that target to change paradigms, challenge the status quo and enhance existing business models and client relationships.

The Most Impactful Best Practices

The protocols and methods used to operate more efficiently and effectively are the existing best practices. Can the best practices fuel growth for the business when shared and implemented with the clients? Talking about your best practices is a conversation you should be well-prepared to have, making it less likely you’ll be blindsided because you didn’t think through all the issues.

…more discussion

Please feel free to email to agilyticsmail@gmail.com to discuss more on this.

Posted in Management | Leave a comment

Application of GIS and Big Data Analytics in Agribusiness

Abstract:                                                                                                                                           “The world doesn’t need any more engineers. We didn’t run out of planes and television sets…we ran out of food.”- INTERSTELLAR (Movie)                                                                 Risk and uncertainty are ubiquitous in agriculture. There are numerous sources of risk in Agri-business such as uncertainties in weather, unpredictable and uncertain nature of biological processes, the pronounced seasonality of production and market cycles, the geographical reach, scope and separation of producers and end consumers of agricultural products. Managing agricultural risk is of particular importance considering the subsistence nature of cultivation in India and smallholder farmers, who are usually more vulnerable because of low adaptive capacity.

Archi

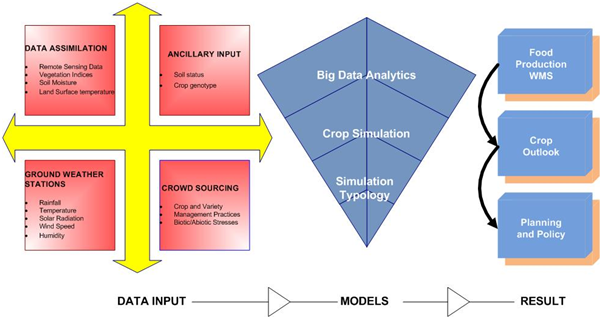
The objective of this paper is to apply ESRI GIS software package and GIS models to Agribusiness Industry and to identify the need of aggregator such as big data analytic for strategic management. The Agricultural Supply Chain comprises of host of interrelated activities from monitoring soil health, water, and nutrients to managing agricultural waste. The major elements of this ecosystem are ‘On Farm Production’, Soil Health, Water, Nutrients, Pests/Control, Energy, Processing, Inspection, Transportation, Storage Retailers, Inventory, Food Safety, Waste and Smart Services.

The pain area where ESRI GIS solution, Remote Sensing and Big Data Analytics can help is by;

  • Predicting Crop yield for all crop types (Rabi, Khareef) Block wise, District-wise and State-wise.
  • Identify clusters (land areas heterogeneous within) for cluster analysis of input data like weather data, soil types, farmers’ input using hand held devices
  • Integration of all input services for live update of big data repository
  • Usage of remote sensing imageries to track changes on the surface

This paper focuses on the role of ESRI GIS solutions, Remote Sensing and Big data analytics as strategic IT enablers in Agribusiness.

P.S. If interested please email to agilyticsmail@gmail.com for a complete copy of this technical paper. #Agilytics

Posted in Technical Papers | Leave a comment

Business in my blood

The aim is crystal clear. The years of working for others and toiling to earn experience and problem solving skills, have finally led to believe that ‘Business is in my blood’. The most basic element of creating and running a business is in the accurate Financial Management.
To be wise, money-wise, is not a skill which is only learnt in a business school. This skill is seeded by the parents when you proudly break your money-bank (gullak) to be guided to invest in fulfilling your dream. The skill to save and invest originates from the childhood and built upon throughout your professional journey.
Having said that the challenge of creating a new business involve crucial initial period of seeding. But these challenges and the desire to face them, will ultimately set the company to the journey of success.
I love my aim. I can’t sit idle. I am on it.

Posted in Management | Leave a comment

Start-up Analytics

To be an entrepreneur is like stepping onto a roller-coaster ride in the world of business. There are ups, there are downs and there are horrifying turns. Sometimes you feel a little frustrated afterwards and sometimes you are inexplicably happy. No matter how many times you ride the coaster or how many people have rode it before you, each go-around feels different. The unpredictability, the uncertainty and the risk are what drive the entrepreneurs to the startup life.

Fortunately, they can find some comfort in start-up analytics. They are logical, they’re rational and they make sense of this challenging lifestyle.But why do so many entrepreneurs find startup analytics intimidating? There are a number of open questions, a lot of blanks and a lot of gray areas. Throw in terms like “growth hacking” and “lean startups” and it’s enough to confuse any beginner. This article is to demystify this world of analytics! It’s not as daunting as it seems.

Metrics Do Matter

First of all the metrics help startups set their goals. And the goals are just dreams with deadlines. Without metrics, it would be impossible to set goals and measure the progress towards them. The goals allow us to be constantly improving and constantly pushing forward.Metrics also help entrepreneurs make smart, informed decisions about the startup. One can identify trends and patterns, problem areas and successes, and potential next steps. Before making major decisions e.g. product iterations and raising capital, startups can consult their metrics. Is it the right time? Will investors take it seriously? Of course, there are a number of other reasons why metrics matter. Progress is the number one factor that motivates us at work. Sharing updates with your team keeps them motivated, informed and focused. Startup launches are losing their PR power, and more and more tech journalists are gravitating towards stories based on growth/success metrics.Without metrics, we don’t know how far we have or have not progressed. We don’t know when our startups are in trouble until it’s too late. We don’t know how to make decisions based on anything other than “entrepreneur intuition”, which definitely doesn’t have a high success rate.Let’s start with a basic fact. Startups are typically at different stages. One startup might be 15 people strong, scaling to 1 million paid users. Another startup might be two co-founders looking for their first 100 free users.The most important metrics depend on the stage of the product. Prior to product/market fit, one should focus on engagement metrics and qualitative feedback from users. This might mean churn, depending on the product category. The better the engagement, the better you set yourself up for growth later on. After the product is working and growing slowly, then the focus would be primarily on growth metrics like signup percents and invite rates.In the beginning, one should focus on engagement metrics and the feedback from users. The reason is that we are still seeking validation and perfecting the product. In the later stages, focus should be on growth metrics. Still, many new entrepreneurs skip right to those growth metrics and many experienced entrepreneurs are stuck on their engagement metrics.What growth metrics should the team be focusing on? Once again, the answer is relative. It really does depend on what your goals are and what you are trying to accomplish in 1, 3, 6, 12 months.Every startup is different, every entrepreneur is different. We all have different goals and different plans for achieving those goals.

Importance of Analytical Context

Entrepreneurs are famous for their willingness to take risks and trust their guts. So, when does context come into play with startup analytics? The simple answer is often.I see people make decisions that are backed by the metrics, but violate common sense. If your ad is working but it is boring, you have a problem. Because as soon as you stop running the ad, the clicks will stop.Sometimes the numbers pull you in one direction when your gut or common sense is pulling you in the opposite direction. Who should you let win? You have to think about analytics in context. People talk about how a landing page may be ugly but acceptable as it converts. Then you need to find how to make it better without ruining the conversion rate–because your image matters too. Startups are bound to operate in the intangible sometimes. The branding and public image is just one example. Measure the tangibles and act on the analytics, but have the intangibles in the back of your mind at all times. Just because you can’t see them on a dashboard doesn’t mean they don’t exist. Sometimes you just have to trust your gut and ignore the numbers in favor of common sense.Always look at your numbers in context.

Startup Analytics Mistakes

1. Dealing in the Success Theater

When one deals with rosy metrics, one actually plays in success theater. You see every aspect of the startup through rose-colored glasses. Startup analytics just don’t work like that. Entrepreneurs can only afford to deal in metrics that help them make decisions about their startups, metrics that lead all the way down to the bottom-line. The problem with rose-colored metrics is that they are the easiest to spot and the easiest to measure.

 2. Focusing only on the Long-term or Short-term goals.

One of the most common questions entrepreneurs have about startup analytics is whether they should focus on the long-term or the short-term. The answer is both.. Let’s say your goal is to increase product signups 30% month over month for three consecutive months. Do you sit in your analytics dashboard for twelve hours every day? The answer is in balancing the short-term with the long-term.

3. Getting Data but Ignoring Action

Collecting data is a great idea for startups at any stage. Hoarding data or neglecting action is not. There is a very big difference between collecting data for the sake of saying you’re collecting data and collecting data to help you make informed decisions and take action. Since the popularity of big data, it seems that some startups believe the more data the better. That’s just not true and it’s not practical for entrepreneurs.

Startup Analytics Best Practices

  • Adopt a lean approach for the Startup Analytics
  • Move from a broader view to narrow views
  • Emphasis on high numbers
  • Utilize testing strategy seriously

When you are at the top of the roller-coaster and waiting for the drop, you want to be sure the coaster is well-built, well-oiled, and well-maintained. That’s where startup analytics come into play. In an up and down world, they help you make informed predictions. Start-up analytics help you ensure you are moving forward. More importantly, they help you avoid the types of drops that startups just don’t recover from.

Posted in Management | Tagged | Leave a comment

Fear of change

“It takes courage to let go of the familiar and embrace the new”.

Recently I talked to one of my close friends who was in trouble for no valid reason. When I dug deep, he
accepted the fact that it may be due to conflict between his push to adopt new learning and the fear of change in the mindset of one senior manager. This guy is leading the software division and happily claims to be a non- technical resource in a technology company.                                                                                                                                                 Quite surprising! Isn’t it.
More surprising was I, when my friend told me that this guy stopped him to impart advanced Python training by quoting directly that “this is not a training institute”. These words were from this guy, as my friend completed beginners level Python training to 30-40 personnel. The feedback was satisfactory.
My friend was pursuing part time MBA from a reputed management institute and his endeavor to change and adopt new technologies like Python, R and Data Sciences had actually worked against his image. This senior manager  was fearful of change. He was unable to accept the initiatives by his junior.
Sadly this may be a common situation in some companies.
It is therefore high time that upper management of companies to wake up  and analyze the mindsets of senior managers.

It’s the high time and in future there will be ‘no time’.

Posted in Management | Leave a comment

ESRI ArcGIS Server Java Script API, Geoenrichment

It’s not hard to create a map and overlay one set of data on it – well, at least not with ArcGIS Online. But what if your users really want to see several types of data, such as demographics, just around particular spots on the map, so they can easily hone in on what matters and compare apples to apples from one spot’s data to another? They could be kind of stuck without a developer like you.

http://blogs.esri.com/esri/arcgis/2013/09/03/javascript-developers-meet-geoenrichment/

1 Comment

Switch on labels

Here is a small piece of code, which can be used to switch on labels. Why do I feel it to be on the post?  Well, due to its simplicity. Have a look: –

Public Sub SwitchOnLabels(pFeatLayer As IFeatureLayer, DisplayField As String)

Dim pGFLayer As IGeoFeatureLayer
Set pGFLayer = pFeatLayer

Dim pLabelEngine As ILabelEngineLayerProperties
Set pLabelEngine = New LabelEngineLayerProperties
Dim pAnnoLayerProps As IAnnotateLayerProperties

Set pAnnoLayerProps = pLabelEngine
Set pAnnoLayerProps.FeatureLayer = pGFLayer

Dim exp As String
exp = "[" & DisplayField & "]"
pLabelEngine.Expression = exp
pLabelEngine.IsExpressionSimple = True
pGFLayer.AnnotationProperties.Clear
pGFLayer.AnnotationProperties.Add pLabelEngine
pGFLayer.DisplayAnnotation = True
End Sub

Posted in ArcObjects with Visual Basic | Leave a comment